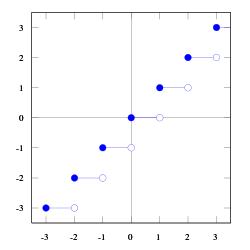
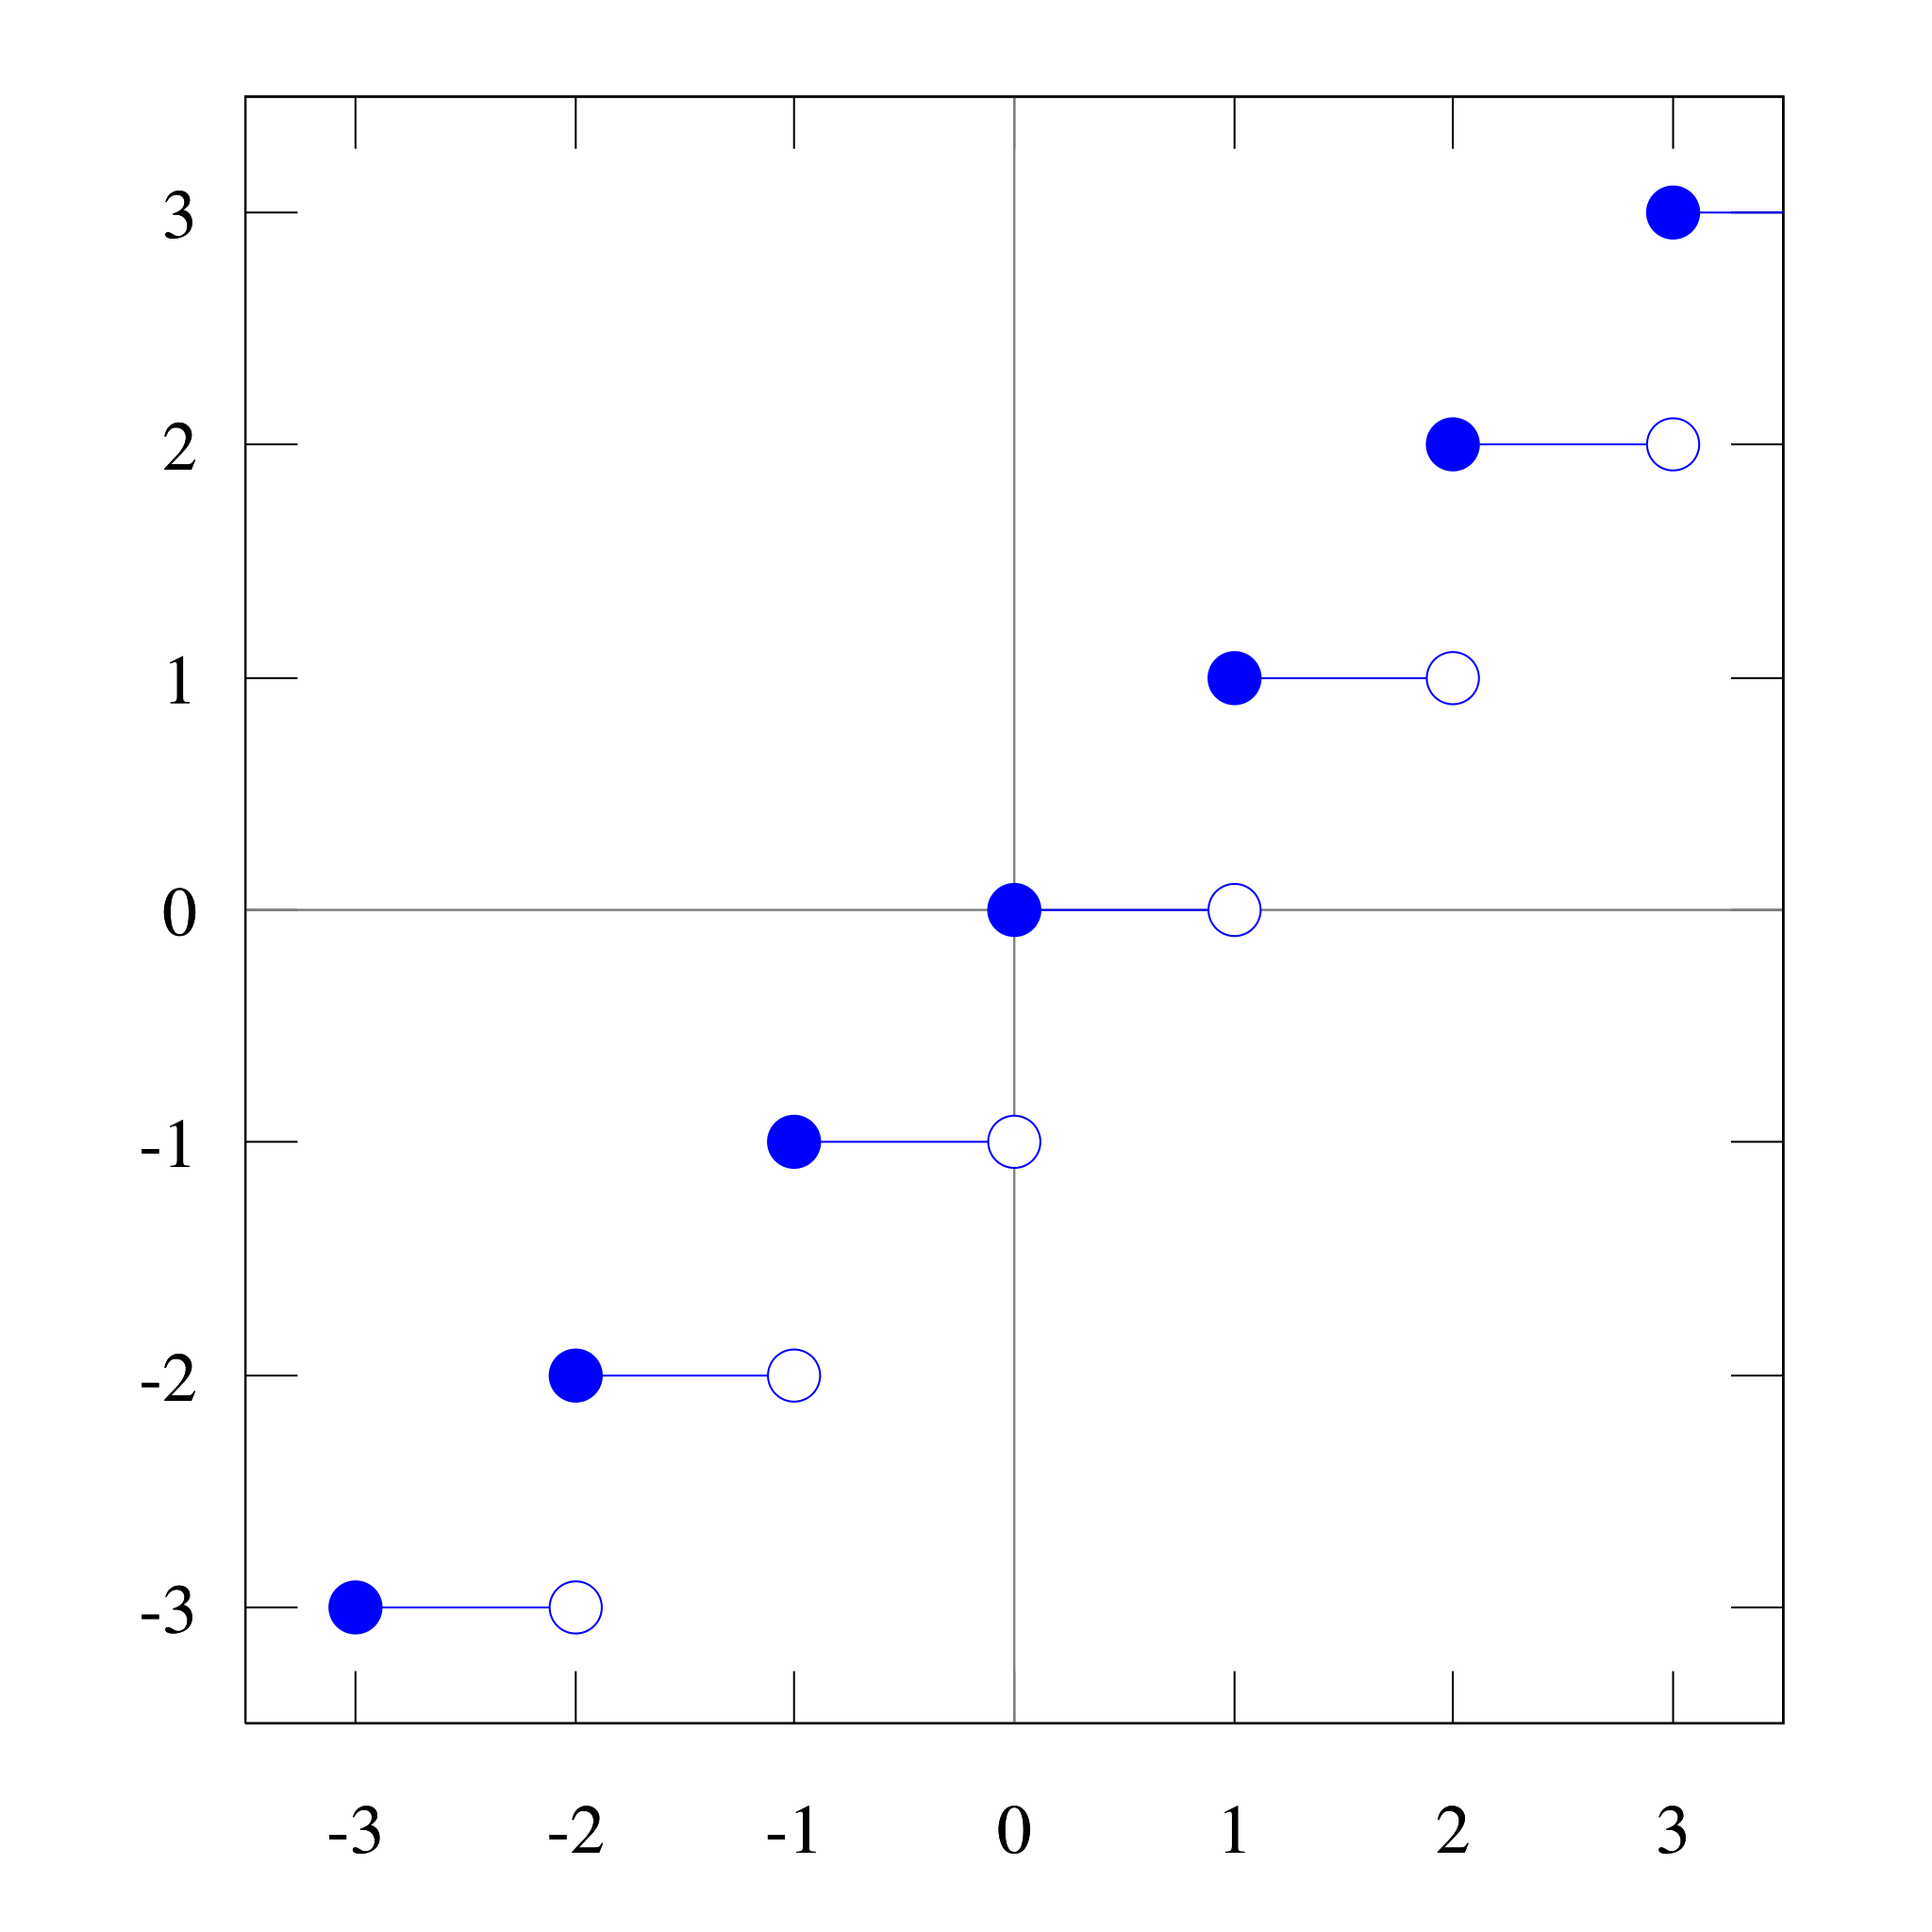
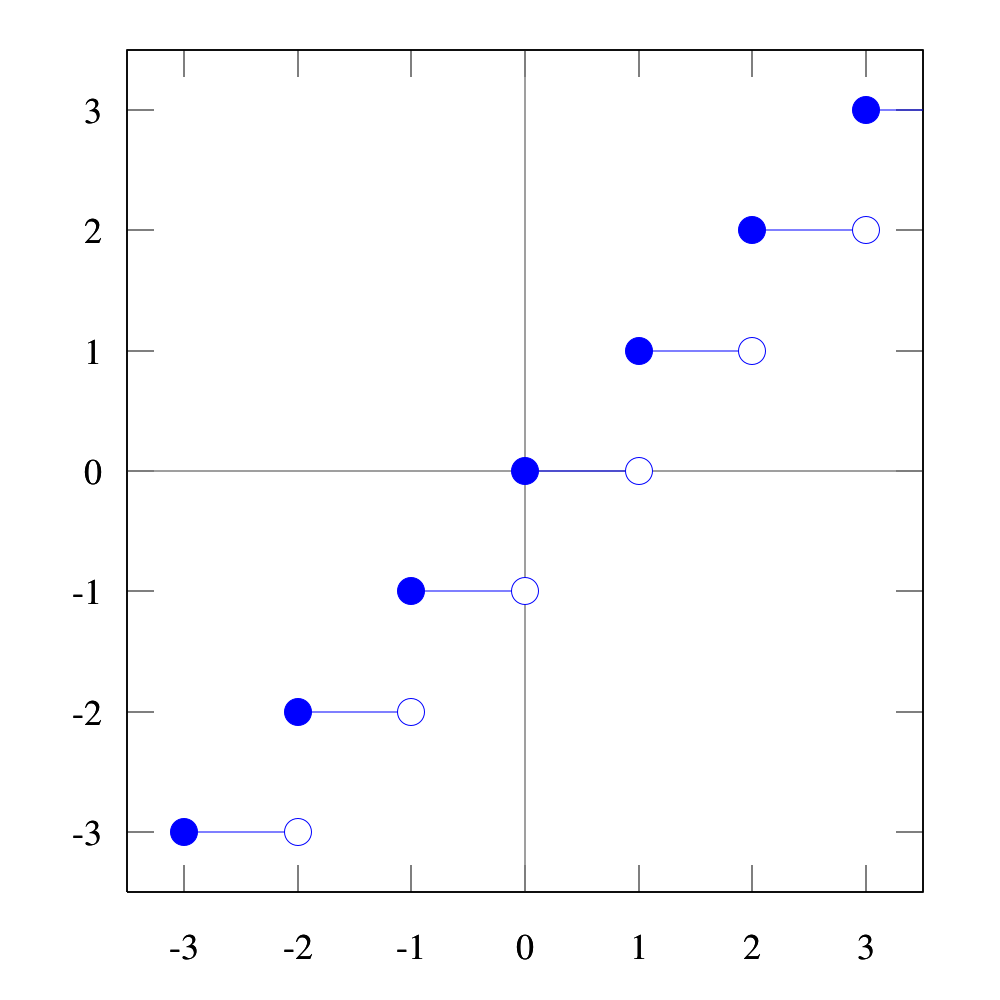
Сурет:Floor function.svg
Навигацияға өту
Іздеуге өту

Size of this PNG preview of this SVG file: 600 × 600 пиксел. Басқа ажыратылымдықтар: 240 × 240 пиксел | 480 × 480 пиксел | 768 × 768 пиксел | 1024 × 1024 пиксел | 2048 × 2048 пиксел | 1000 × 1000 пиксел.
Түпнұсқа файл (SVG файлы, кесімді 1000 × 1000 (пиксел) нүкте, файл өлшемі: 16 КБ)
Түйін
| Сипаттамасы | |
| Күні | 30 наурыз 2006 (original upload date) |
| Көзі | Өзімнің туындым |
| Авторы | No machine-readable author provided. Omegatron (талқылауы · үлесі) assumed (based on copyright claims). |
| Басқа нұсқалары |
|
| SVG genesis |


Лицензиялау
Created by User:Omegatron using gnuplot, possibly with post-processing in the GIMP (PNG) or Inkscape (SVG)
Мен бұл туындының авторымын, келесі лицензия аясында бұны жариялаймын:
Бұл файл Creative Commons Attribution-Share Alike 3.0 Unported, 2.5 Generic, 2.0 Generic and 1.0 Generic лицензиялары бойынша қолжетімді.
- Сіз келесі әрекеттерге еркінсіз:
- бөлісу – туындыны көшіру, тарату және тапсыру
- мазмұнын өзгерту – туындыны бейімдеу
- Келесі ережелерді сақтағанда:
- атрибуция – Авторлықты белгілеп, лицензияға сілтеме беріп, өзгеріс жасалғанын анықтауыңыз керек. Сіз мұны кез келген орынды жолмен істей аласыз, бірақ лицензиар сізді немесе қолдануыңызды мақұлдайтындай емес.
- бірдей шарттарда тарату – Материалды өзгертсеңіз, түрлендірсеңіз не осыған қарап басқасын құрастырсаңыз, үлесіңізді түпнұсқанікінде не соған үйлесімді лицензия қолдануыңыз керек керек.

|
Бұл файлды GNU Free Documentation License лицензиясының 1.2 нұсқасы бойынша немесе ескі Ашық бағдарламалық жасақтаушы қорымен жарияланған нұсқасының шарттарына сәйкес көшірмесін алуға, таратуға және/немесе өзгертуге болады. Лицензия көшірмесі GNU Free Documentation License деп аталынған бөлімде көрсетілген. |
Өз қалауыңызбен лицензияны таңдауыңызға болады.
(In short, this means that you can copy and modify the image freely as long as you provide attribution; preferably in the form of a link back to this page.)
Instructions
See Wikipedia graph-making tips.
 # Set square 1000×1000 SVG output and filename
 # The font size (fsize) sets the size for the circles, too.
 set terminal svg enhanced size 1000 1000 fname "Times" fsize 36
 set output "floor.svg"

 # Set the text value for missing entries in the data file, so we can plot a [[w:discontinuous function|discontinuous function]]
 set datafile missing "Skip"

 # Set y axis limits so the plot doesn't go right to the edges of the graph
 set yrange [-3.5:3.5]
 # Set x axis limits so the first and last points are hidden
 set xrange [-3.5:3.5]

 # No legend needed
 set nokey

 # Add lightly-colored axis lines
 set yzeroaxis
 set xzeroaxis

 # Plot as lines and also points (circles)
 plot "floor.dat" with lines
 plot "floor.dat" with points 1 6

 # Close the file (so I don't have to close gnuplot to view it)
 set output
and data file:
floor.dat
#  X     Y1
   -3    -4
   Skip
   -3    -3
   -2    -3
   Skip
   -2    -2
   -1    -2
   Skip
   -1    -1
   0     -1
   Skip
   0     0
   1     0
   Skip
   1     1
   2     1
   Skip
   2     2
   3     2
   Skip
   3     3
   4     3
Then I opened the resulting SVG file in Inkscape, changed the fill style for the circles (either blue or white fill), brought the plot lines to the top, and then brought the circles to the top (over the lines).
External links
Файл тарихы
Файл сол кезде қалай көрінгенін көру үшін күн/уақыт дегенге басыңыз.
| Күн/Уақыт | Нобай | Өлшемдер | Қатысушы | Пікір | |
|---|---|---|---|---|---|
| қазіргі | 01:05, 2006 ж. мамырдың 22 | | 1000 × 1000 (16 КБ) | wikimediacommons>Omegatron | i like blue better |
Файл қолданылуы
Бұл файлды мына бет қолданады: